The Seven Management and Planning Tools

The Seven Management and Planning Tools have their roots in Operations Research work done after World War II and the Japanese Total Quality Control (TQC) research.

In 1979 the book Seven New Quality Tools for Managers and Staff was published and was translated into English in 1983.

The Seven Tools

Affinity Diagram (KJ Method)

Affinity Diagram

Affinity diagrams are a special kind of brainstorming tool that organize large amounts of disorganized data and information into groupings based on natural relationships.

It was created in the 1960s by the Japanese anthropologist Jiro Kawakita. Its also known as KJ diagram,after Jiro Kawakita.When to Use an Affinity Diagram 1)When you are confronted with many facts or ideas in apparent chaos 2)When issues seem too large and complex to grasp

Interrelationship Digraph (ID)

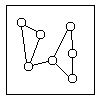
Interrelationship Digraph

This tool displays all the interrelated cause-and-effect relationships and factors involved in a complex problem and describes desired outcomes. The process of creating an interrelationship digraph helps a group analyze the natural links between different aspects of a complex situation.

Tree Diagram

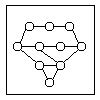
Tree Diagram

This tool is used to break down broad categories into finer and finer levels of detail. It can map levels of details of tasks that are required to accomplish a goal or solution or task. Developing the tree diagram helps one move their thinking from generalities to specifics.

Prioritization Matrix

Matrix Diagram

This tool is used to prioritize items and describe them in terms of weighted criteria. It uses a combination of tree and matrix diagramming techniques to do a pair-wise evaluation of items and to narrow down options to the most desired or most effective. Popular applications for the Prioritization Matrix include Return-on-Investment (ROI) or Cost-Benefit analysis (Investment vs. Return), Time management Matrix (Urgency vs. Importance), etc.

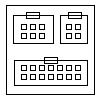
Matrix Diagram

Matrix Diagram

This tool shows the relationship between items. At each intersection a relationship is either absent or present. It then gives information about the relationship, such as its strength, the roles played by various individuals or measurements. Six differently shaped matrices are possible: L, T, Y, X, C, R and roof-shaped, depending on how many groups must be compared.

Process Decision Program Chart (PDPC)

Process Decision Program Chart

A useful way of planning is to break down tasks into a hierarchy, using a tree diagram. The PDPC extends the tree diagram a couple of levels to identify risks and countermeasures for the bottom level tasks. Different shaped boxes are used to highlight risks and identify possible countermeasures (often shown as ‘clouds’ to indicate their uncertain nature). The PDPC is similar to the Failure Modes and Effects Analysis (FMEA) in that both identify risks, consequences of failure, and contingency actions; the FMEA also rates relative risk levels for each potential failure point.

Activity Network Diagram

Arrow Diagram

This tool is used to plan the appropriate sequence or schedule for a set of tasks and related subtasks. It is used when subtasks must occur in parallel. The diagram enables one to determine the critical path (longest sequence of tasks). (See also PERT diagram.)

Further reading

External links

An Introduction to the TOC Thinking Processes

It’s Not Luck (1994) is a business novel and a sequel to The Goal. The plot continues to follow the advancement of the main character, Alex Rogo, through the corporate ranks of large manufacturer, UniCo.

Author Dr. Eliyahu M. Goldratt continues to teach the reader his thinking processes through the eyes of Alex Rogo as he learns from his mentor, Jonah. In this book, the primary subjects are the resolution of conflict through the evaporating clouds method and the identification of root causes through the effect-cause-effect method.

In this book the main character, Alex, conducts the reader through the essence of some TOC tools and applications, like the Thinking Processes and the TOC solutions for Marketing, Distribution and how to compose the Strategy of a company.


AN INTRODUCTION TO THE TOC THINKING PROCESSES

by Dongxiao Qiu
for the Ross Clouston Scholarship, 2001

Continue reading “An Introduction to the TOC Thinking Processes”

Six Thinking Hats

Six Thinking Hats is a book by Edward de Bono which describes a tool for group discussion and individual thinking involving six colored hats. “Six Thinking Hats” and the associated idea parallel thinking provide a means for groups to plan thinking processes in a detailed and cohesive way, and in doing so to think together more effectively.[2]

In 2005, the tool found some use in the United Kingdom innovation sector, where it was offered by some facilitation companies and had been trialled within the United Kingdom’s civil service.

The premise of the method is that the human brain thinks in a number of distinct ways which can be deliberately challenged, and hence planned for use in a structured way allowing one to develop tactics for thinking about particular issues. De Bono identifies six distinct directions in which the brain can be challenged. In each of these directions the brain will identify and bring into conscious thought certain aspects of issues being considered (e.g. gut instinct, pessimistic judgement, neutral facts). None of these directions are completely natural ways of thinking, but rather how some of us already represent the results of our thinking. Since the hats do not represent natural modes of thinking, each hat must be used for a limited time only. Also, many will feel that using the hats is unnatural, uncomfortable or even counter productive and against their better judgement. A compelling example presented is sensitivity to “mismatch” stimuli. This is presented as a valuable survival instinct, because, in the natural world: the thing that is out of the ordinary may well be dangerous. This mode is identified as the root of negative judgement and critical thinking. Six distinct directions are identified and assigned a color. The six directions are:

  • Managing (Blue) – what is the subject? what are we thinking about? what is the goal?
  • Information (White) – considering purely what information is available, what are the facts?
  • Emotions (Red) – intuitive or instinctive gut reactions or statements of emotional feeling (but not any justification)
  • Discernment (Black) – logic applied to identifying reasons to be cautious and conservative
  • Optimistic response (Yellow) – logic applied to identifying benefits, seeking harmony
  • Creativity (Green) – statements of provocation and investigation, seeing where a thought goes

Coloured hats are used as metaphors for each direction. Switching to a direction is symbolized by the act of putting on a coloured hat, either literally or metaphorically. These metaphors allow for a more complete and elaborate segregation of the thinking directions. The six thinking hats indicate problems and solutions about an idea the thinker may come up with.

Yves Morieux

Published on Jan 23, 2014

Why do people feel so miserable and disengaged at work? Because today’s businesses are increasingly and dizzyingly complex — and traditional pillars of management are obsolete, says Yves Morieux. So, he says, it falls to individual employees to navigate the rabbit’s warren of interdependencies. In this energetic talk, Morieux offers six rules for “smart simplicity.” (Rule One: Understand what your colleagues actually do.)

TEDTalks is a daily video podcast of the best talks and performances from the TED Conference, where the world’s leading thinkers and doers give the talk of their lives in 18 minutes (or less). Look for talks on Technology, Entertainment and Design — plus science, business, global issues, the arts and much more.
Find closed captions and translated subtitles in many languages athttp://www.ted.com/translate

Lanczos algorithm

Lanczos algorithm

From Wikipedia, the free encyclopedia
The Lanczos algorithm is an iterative algorithm invented by Cornelius Lanczos that is an adaptation of power methods to findeigenvalues and eigenvectors of a square matrix or the singular value decomposition of a rectangular matrix. It is particularly useful for finding decompositions of very large sparse matrices. In Latent Semantic Indexing, for instance, matrices relating millions of documents to hundreds of thousands of terms must be reduced to singular-value form.
Peter Montgomery published in 1995 an algorithm, based on the Lanczos algorithm, for finding elements of the nullspace of a large sparse matrix over GF(2); since the set of people interested in large sparse matrices over finite fields and the set of people interested in large eigenvalue problems scarcely overlap, this is often also called the block Lanczos algorithm without causing unreasonable confusion. See Block Lanczos algorithm for nullspace of a matrix over a finite field.