pay it forward

The expression “pay it forward” is used to describe the concept of asking the beneficiary of a good deed to repay it to others instead of to the original benefactor. The concept is old, but the phrase may have been coined by Lily Hardy Hammond in her 1916 book In the Garden of Delight.[1]

Pay it forward” is implemented in contract law of loans in the concept of third party beneficiaries. Specifically, the creditor offers the debtor the option of “paying” the debt forward by lending it to athird person instead of paying it back to the original creditor. Debt and payments can be monetary or by good deeds. A related type of transaction, which starts with a gift instead of a loan, isalternative giving.

Hindsight bias

Hindsight bias, also known as the knew-it-all-along effect or creeping determinism, is the inclination, after an event has occurred, to see the event as having been predictable, despite there having been little or no objective basis for predicting it, prior to its occurrence.[1][2] It is a multifaceted phenomenon that can affect different stages of designs, processes, contexts, and situations.[3] Hindsight bias may cause memory distortion, where the recollection and reconstruction of content can lead to false theoretical outcomes. It has been suggested that the effect can cause extreme methodological problems while trying to analyze, understand, and interpret results in experimental studies. A basic example of the hindsight bias is when, after viewing the outcome of a potentially unforeseeable event, a person believes he or she “knew it all along”. Such examples are present in the writings of historians describing outcomes of battles, physicians recalling clinical trials, and in judicial systems trying to attribute responsibility and predictability of accidents.

Role Theory

Role Theory proposed that human behavior is guided by expectations held both by the individual and by other people. The expectations correspond to different roles individualsperform or enact in their daily lives, such as secretary, father, or friend. For instance, most people hold pre-conceived notions of the role expectations of a secretary, which might include: answering phones, making and managing appointments, filing paperwork, and typing memos. These role expectations would not be expected of a professional soccer player.

Individuals generally have and manage many roles. Roles consist of a set of rules or norms that function as plans or blueprints to guide behavior. Roles specify what goals should be pursued, what tasks must be accomplished, and what performances are required in a given scenario or situation. Role theory holds that a substantial proportion of observable, day-to-day social behavior is simply persons carrying out their roles, much as actors carry out their roles on the stage or ballplayers theirs on the field. Role theory is, in fact, predictive. It implies that if we have information about the role expectations for a specified position (e.g., sister, fireman, prostitute), a significant portion of the behavior of the persons occupying that position can be predicted.

What’s more, role theory also argues that in order to change behavior it is necessary to change roles; roles correspond to behaviors and vice versa. In addition to heavily influencing behavior, roles influence beliefs and attitudes; individuals will change their beliefs and attitudes to correspond with their roles. For instance, someone over-looked for a promotion to a managerial position in a company may change their beliefs about the benefits of management by convincing him/herself that they didn’t want the additional responsibility that would have accompanied the position.

Many role theorists see Role Theory as one of the most compelling theories bridging individual behavior and social structure. Roles, which are in part dictated by social structure and in part by social interactions (see the two approaches outlined below), guide the behavior of the individual. The individual, in turn, influences the norms, expectations, and behaviors associated with roles. The understanding is reciprocal and didactic.

Power and dominance

Non verbal expressions of power and dominance are gestures or motions that assert one´s authority over another.

handshakes
waving
smiling

The colors one wears affect other´s perceptions of one´s authority:

purple: people of high status adorn their clothing with purple to distinguish themselves as noble or wealthy

people attribute greater authority to others wearing red

It is human to strive for power and dominance in social settings

simple gestures establish authority

A firmer handshake
Better posture
Causing slight interruptions in conversation

can rise authority in group situations

many peers view Non verbal expressions of power and dominance as manipulation for self gain

Their abuse can be disastrous

Men and women have different perceptions of Non verbal expressions of power and dominance

Nodding is misinterpreted in cross gender communication

women interpret a nod as a signal of understanding

men interpret a nod as a signal of agreement

small miscommunications and misinterpretations lead to disagreement and confrontation

Russel (as cited in Dunbar & Burgoon, 2005) describes, “the fundamental concept in social science is power, in the same way that energy is the fundamental concept in physics“. Power and dominance-submission are two key concepts in relationships, especially close relationships where individuals rely on one another to achieve their goals (Dunbar & Burgoon, 2005) and as such it is important to be able to identify indicators of dominance.

Power and dominance are different concepts yet share similarities. Power is the ability to influence behavior (Bachrach & Lawler; Berger; Burgoon et al.; Foa & Foa; French & Raven; Gray-Little & Burks; Henley; Olson & Cromwell; Rollins & Bahr, as cited in Dunbar & Burgoon, 2005) and may or may not be fully evident until challenged by an equal force (Huston, as cited in Dunbar & Burgoon, 2005). Unlike power, that may be latent, dominance is manifest reflecting individual (Komter, as cited in Dunbar & Burgoon, 2005), situational and relationship patterns where control attempts are either accepted or rejected (Rogers-Millar & Millar,as cited in Dunbar & Burgoon, 2005). Moskowitz, Suh, and Desaulniers (1994) mention two similar ways that people can relate to the world in interpersonal relationships: agency and communion. Agency includes status and is a continuum from assertiveness-dominance to passive-submissiveness – it can be measured by subtracting submissiveness from dominance. Communion is a second way to interact with others and includes love with a continuum from warm-agreeable to cold-hostile-quarrelsomeness. Power and dominance relate together in such a way that those with the greatest and least power typically do not assert dominance while those with more equal relationships make more control attempts Dunbar & Burgoon, 2005).

As one can see, power and dominance are important, intertwined, concepts that greatly impact relationships. In order to understand how dominance captures relationships one must understand the influence of gender and social roles while watching for verbal and nonverbal indicators of dominance.

wagon-wheel effect

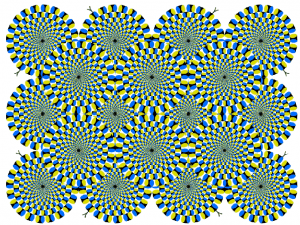
The wagon-wheel effect (alternatively, stagecoach-wheel effectstroboscopic effect) is an optical illusion in which a spoked wheelappears to rotate differently from its true rotation. The wheel can appear to rotate more slowly than the true rotation, it can appear stationary, or it can appear to rotate in the opposite direction from the true rotation. This last form of the effect is sometimes called thereverse rotation effect.

The wagon-wheel effect is most often seen in film or television depictions of stagecoaches or wagons in Western movies, although recordings of any regularly spoked wheel will show it, such as helicopter rotors and aircraft propellers. In these recorded media, the effect is a result of temporal aliasing.[1] It can also commonly be seen when a rotating wheel is illuminated by flickering light. These forms of the effect are known as stroboscopic effects: the original smooth rotation of the wheel is visible only intermittently. A version of the wagon-wheel effect can also be seen under continuous illumination.

Rushton (1967[5]) observed the wagon-wheel effect under continuous illumination while humming. The humming vibrates the eyes in their sockets, effectively creating stroboscopic conditions within the eye. By humming at a frequency of a multiple of the rotation frequency, he was able to stop the rotation. By humming at slightly higher and lower frequencies, he was able to make the rotation reverse slowly and to make the rotation go slowly in the direction of rotation. A similar stroboscopic effect is now commonly observed by people eating crunchy foods, such as carrots, while watching TV: the image appears to shimmer.[6] The crunching vibrates the eyes at a multiple of the frame rate of the TV. Besides vibrations of the eyes, the effect can be produced by observing wheels via a vibrating mirror. Rear-view mirrors in vibrating cars can produce the effect.

Truly continuous illumination

The first to observe the wagon-wheel effect under truly continuous illumination (such as from the sun) was Schouten (1967[7]). He distinguished three forms of subjective stroboscopy which he called alpha, beta, and gamma: Alpha stroboscopy occurs at 8–12 cycles per second; the wheel appears to become stationary, although “some sectors [spokes] look as though they are performing a hurdle race over the standing ones” (p. 48). Beta stroboscopy occurs at 30–35 cycles per second: “The distinctness of the pattern has all but disappeared. At times a definite counterrotation is seen of a grayish striped pattern” (pp. 48–49). Gamma stroboscopy occurs at 40–100 cycles per second: “The disk appears almost uniform except that at all sector frequencies a standing grayish pattern is seen … in a quivery sort of standstill” (pp. 49–50). Schouten interpreted beta stroboscopy, reversed rotation, as consistent with there being Reichardt detectors in the human visual system for encoding motion. Because the spoked wheel patterns he used (radial gratings) are regular, they can strongly stimulate detectors for the true rotation, but also weakly stimulate detectors for the reverse rotation.

There are two broad theories for the wagon-wheel effect under truly continuous illumination. The first is that human visual perception takes a series of still frames of the visual scene and that movement is perceived much like a movie. The second is Schouten’s theory: that moving images are processed by visual detectors sensitive to the true motion and also by detectors sensitive to opposite motion from temporal aliasing. There is evidence for both theories, but the weight of evidence favours the latter.

Discrete frames theory

Purves, Paydarfar, and Andrews (1996[8]) proposed the discrete-frames theory. One piece of evidence for this theory comes from Dubois and VanRullen (2011[9]). They reviewed experiences of users of LSD who often report that under the influence of the drug a moving object is seen trailing a series of still images behind it. They asked such users to match their drug experiences with movies simulating such trailing images viewed when not under the drug. They found that users selected movies around 15–20 Hz. This is between Schouten’s alpha and beta rates.

Other evidence for the theory is reviewed next.

Temporal aliasing theory

Kline, Holcombe, and Eagleman (2004[10]) confirmed the observation of reversed rotation with regularly spaced dots on a rotating drum. They called this “illusory motion reversal”. They showed that these occurred only after a long time of viewing the rotating display (from about 30 seconds to as long as 10 minutes for some observers). They also showed that the incidences of reversed rotation were independent in different parts of the visual field. This is inconsistent with discrete frames covering the entire visual scene. Kline, Holcombe, and Eagleman (2006[11]) also showed that reversed rotation of a radial grating in one part of the visual field was independent of superimposed orthogonal motion in the same part of the visual field. The orthogonal motion was of a circular grating contracting so as to have the same temporal frequency as the radial grating. This is inconsistent with discrete frames covering local parts of visual scene. Kline et al. concluded that the reverse rotations were consistent with Reichardt detectors for the reverse direction of rotation becoming sufficiently active to dominate perception of the true rotation in a form of rivalry. The long time required to see the reverse rotation suggests that neural adaptation of the detectors responding to the true rotation has to occur before the weakly stimulated reverse-rotation detectors can contribute to perception.

Some small doubts about the results of Kline et al. (2004) sustain adherents of the discrete-frame theory. These doubts include Kline et al.’s finding in some observers more instances of simultaneous reversals from different parts of the visual field than would be expected by chance, and finding in some observers differences in the distribution of the durations of reversals from that expected by a pure rivalry process (Rojas, Carmona-Fontaine, López-Calderón, & Aboitiz, 2006[12]).

In 2008, Kline and Eagleman demonstrated that illusory reversals of two spatially overlapping motions could be perceived separately, providing further evidence that illusory motion reversal is not caused by temporal sampling.[13] They also showed that illusory motion reversal occurs with non-uniform and non-periodic stimuli (for example, a spinning belt of sandpaper), which also cannot be compatible with discrete sampling. Kline and Eagleman proposed instead that the effect results from a “motion during-effect”, meaning that a motion after-effect becomes superimposed on the real motion.

Dangers

Because of the illusion this can give to moving machinery, it is advised that single-phase lighting be avoided in workshops and factories. For example, a factory that is lit from a single-phase supply with basic fluorescent lighting will have a flicker of twice the mains frequency, either at 100 or 120 Hz (depending on country); thus, any machinery rotating at multiples of this frequency may appear to not be turning. Seeing that the most common types of AC motors are locked to the mains frequency, this can pose a considerable hazard to operators of lathes and other rotating equipment. Solutions include deploying the lighting over a full 3-phase supply, or by using high-frequency controllers that drive the lights at safer frequencies.[14] Traditional incandescent light bulbs, which employ filaments that glow continuously, offer another option as well, albeit at the expense of increased power consumption. Smaller incandescent lights can be used as task lighting on equipment to help combat this effect to avoid the cost of operating larger quantities of incandescent lighting in a workshop environment.


rotatingwheels


Interactive Whiteboard Software

http://open-sankore.org/en/tutorials

Universal Interactive Whiteboard Software – top 3 so far

Don’t you wish there was a universal interactive whiteboard program – that could work on any IWB whether it was a home made WiiMote to a $10000 interactive LCD/LED screen.
eBeam ScrapBook. My pick for Primary to middle school, ebeam scapbook is a solid IWB program that does not require you to own an eBeam or have one connected for it to work. With things like video and stroke playback, the ability to bring in just about any image file plus flash animations and video its a well rounded package. Saves as either proprietary, HTML PDF, PPT, JPG, or PNG. Cross platform.Microsoft OneNote. Seriously overlooked and most people don’t even know they have it. This is my pick for middle and high schools plus tertiary and training centres. Great range of tools and drawing capability. The handwriting recognition is fantastic and the math symbol recognition is great if a little buggy. The sharing function is great if you are online and want to share your notebook.
Saves files as Onenote, PDF, DOC, HTML.

Open Sankore. this is a little different but once you get used to it holy cow. This is one of the most feature-full IWB programs I have come across. It’s a regular IWB in many respects with a smaller gallery than most but nothing that can’t be expanded. But the widgets/apps that you can add are amazing.

Imagine being able to embed just about any file from the web
Imagine having a google map working within your whiteboard – wikipedia and wikictionary as well.
Imagine being able to have a page as big as you want (scrolling)
Imagine being able to embed working websites into the document
Imagine being able to create your own widgets with a just using HTML and CSS

I’d give this a go in a classroom – the interface is non standard but does make sense and auto saves your work until you want to export it. It has a nice extended desktop function for interactive pen displays.
Exports only as Sankore or PDF.


Read more: http://halljackson.blogspot.com/2012/05/universal-interactive-whiteboard.html#ixzz34a8Nr098

education system

“The world economy no longer pays for what people know but for what they can do with what they know.”
– Andreas Schleicher, OECD deputy director for education

[ted id=66]

Sir Ken Robinson makes an entertaining and profoundly moving case for creating an education system that nurtures (rather than undermines) creativity.

http://thelearningcurve.pearson.com/2014-report-summary/

East Asian nations continue to outperform others. South Korea tops the rankings, followed by Japan (2nd), Singapore (3rd) and Hong Kong (4th). All these countries’ education systems prize effort above inherited ‘smartness’, have clear learning outcomes and goalposts, and have a strong culture of accountability and engagement among a broad community of stakeholders.
Scandinavian countries, traditionally strong performers, are showing signs of losing their edge. Finland, the 2012 Index leader, has fallen to 5th place; and Sweden is down from 21st to 24th.
Notable improvers include Israel (up 12 places to 17th), Russia (up 7 places to 13th) and Poland (up four places to 10th).
Developing countries populate the lower half of the Index, with Indonesia again ranking last of the 40 nations covered, preceded by Mexico (39th) and Brazil (38th).

South Korea demonstrates the interplay between adult skills and the demands of employers. In South Korea young people score above average for numeracy and problem-solving skills, but are below average over the age of 30. According to Randall S Jones of the OECD, this skills decline is explained by many graduates “training for white-collar jobs that don’t exist”. This leads to a higher than average proportion failing to secure employment, and a quicker diminishing of their skills.

Developing countries must teach basic skills more effectively before they start to consider the wider skills agenda. There is little point in investing in pedagogies and technologies to foster 21st century skills, when the basics of numeracy and literacy aren’t in place.

Technology can provide new pathways into adult education, particularly in the developing world, but is no panacea. There is little evidence that technology alone helps individuals actually develop new skills.

Lifelong learning, even simple reading at home and number crunching at work, helps to slow the rate of age-related skill decline; but mainly for those who are highly skilled already. Teaching adults does very little to make up for a poor school system.

Making sure people are taught the right skills early in their childhood is much more effective than trying to improve skills in adulthood for people who were let down by their school system. But even when primary education is of a high quality, skills decline in adulthood if they are not used regularly.

In recent years it has become increasingly clear that basic reading, writing and arithmetic are not enough.
The importance of 21st century non-cognitive skills – broadly defined as abilities important for social interaction – is pronounced.

The OECD estimates that half of the economic growth in developed countries in the last decade came from improved skills.

growth–share matrix

The growth–share matrix (aka the product portfolio,[1] BCG-matrix, Boston matrix, Boston Consulting Group analysis, portfolio diagram) is a chart that was created by Bruce D. Henderson for the Boston Consulting Group in 1970 to help corporations to analyze their business units, that is, their product lines. This helps the company allocate resources and is used as an analytical tool in brand marketingproduct managementstrategic management, and portfolio analysis.[2] Analysis of market performance by firms using its principles has recently called its usefulness into question.[3]

Bruce Doolin Henderson (1915–1992) was the founder of the Boston Consulting Group (BCG). Henderson founded BCG in 1963 in BostonMassachusetts. He headed the firm as President and CEO until 1980 and stayed on as Chairman until 1985.